Grafana and Prometheus
HTC-Grid blueprint deploys Grafana and Prometheus as pods within the EKS Cluster (in this case using OnDemand instances, given that these services are expected to have a state).
While the deployment of Grafana uses self-signed certifictes for encryption, our end plan for HTC-Grid is to adhere to the tenets. We are planning to move over to Amazon Managed Service for Prometheus (currently in preview) and Amazon Managed Service for Grafana.
Create a cognito user (CLI)
All the services accessible via a public URL require authentication via Amazon Cognito. In the case of Grafana, a default user called admin is created as part of the deployment.
The initial password for the user will be the value for GRAFANA_ADMIN_PASSWORD, as used in the section Deploy HTC-Grid. However, you will be required to change this upon your first login.
In addition to the already setup admin user, more users can be created as below:
Replace <my_cognito_user> and <my_cognito_password> with your own username and password.
Choose a Cognito username and password, making sure they follow the Amazon Cognito Default Policy:
cd ~/environment/aws-htc-grid
export USERNAME=<my_cognito_user>
export PASSWORD=<my_grafana_admin_password>
Running the following commands will create the above user in Cognito, with the value of PASSWORD as an initial password:
userpoolid=$(make get-userpool-id TAG=$TAG REGION=$HTCGRID_REGION)
aws cognito-idp admin-create-user --user-pool-id $userpoolid --username $USERNAME --temporary-password $PASSWORD --region $HTCGRID_REGION
Grafana
During the Deploy HTC-Grid section you replaced and selected a <my_grafana_admin_password> that we will need now to access Grafana. The HTC-Grid project captures metrics into InfluxDB and Prometheus and exposes those metrics through Grafana.
The URL for the Grafana service can be retrieved as below:
kubectl -n grafana get ingress | tail -n 1 | awk '{ print "Grafana URL -> https://"$4 }'
it should output something like:
Grafana URL -> https://k8s-grafana-grafanai-XXXXXXXXXXXX-YYYYYYYYYYY.eu-west-2.elb.amazonaws.com
When you open this URL, you should be redirected to a Cognito sign in page. Please enter either the default username or one the additional users created in the previous section and their respective password and then click Sign In.
Once you are signed in with Cognito, you will be redirected to the Grafana sign in page.
Pleas use the user admin and the password you selected at creation time to login into Grafana.
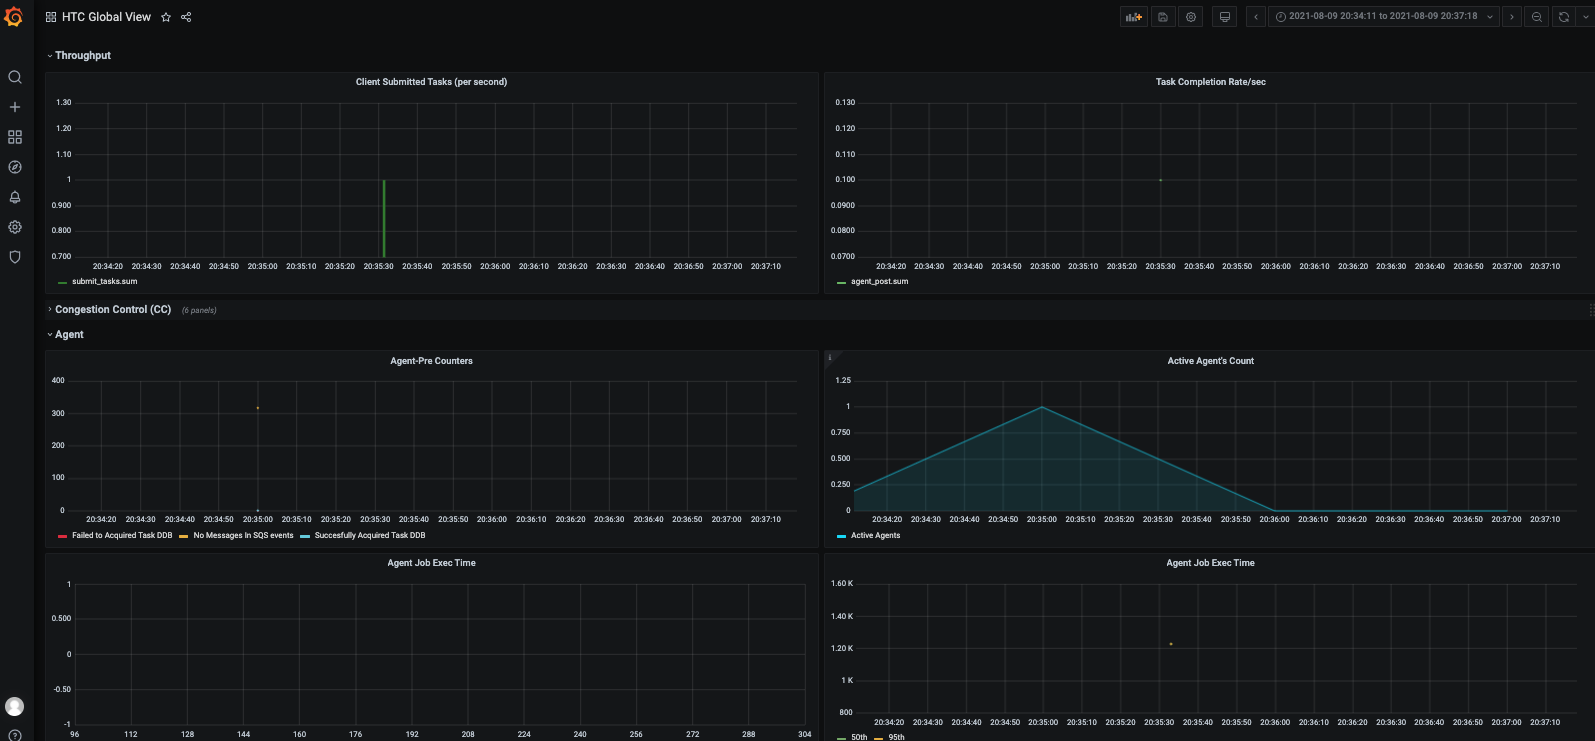
Once in, on the left hand side menu, click on Dashboards and then select Manage. This will take you to the two dashboards that have been created at this stage. One for the EKS Cluster and another one with a few metrics relevant to HTC-Grid components.
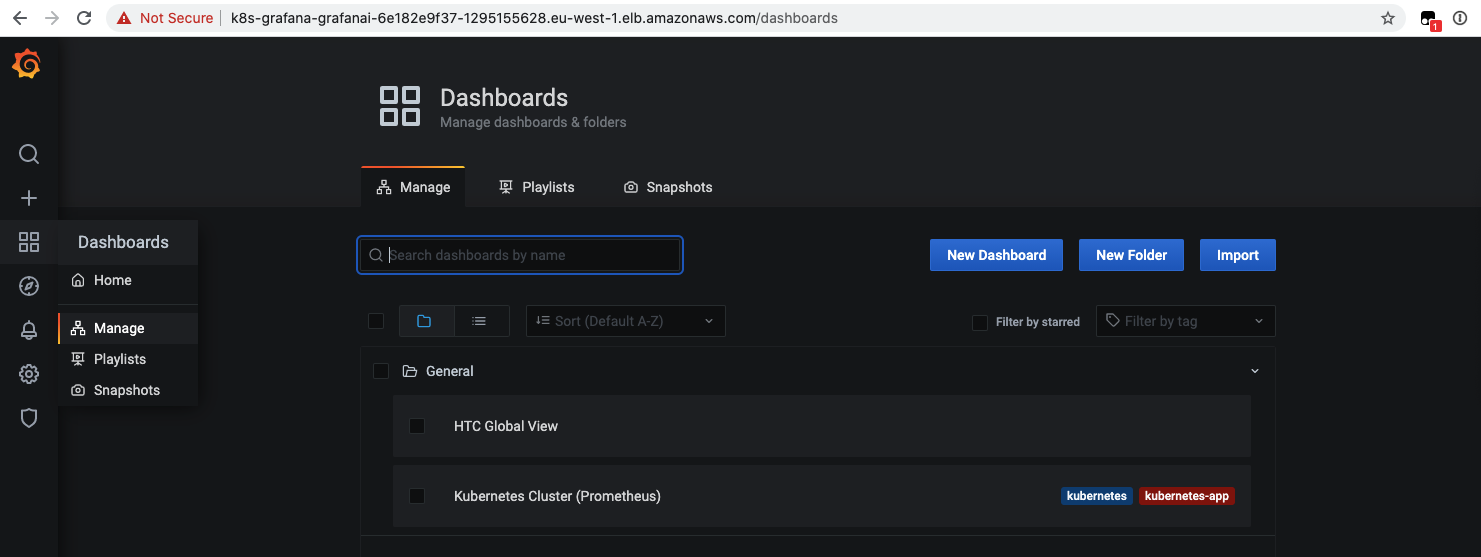
At this stage most of the dashboards will be nearly empty of data as we just have submitted a single task. Later on, as we create more tasks, we will be able to see how this dashboards represent the workloads running on HTC-Grid
Prometheus
Prometheus is other of the services used to store time series for the EKS cluster. In order to access the Prometheus server URL, we are going to use the kubectl port-forward command to access the application. In Cloud9, open a new terminal and run:
kubectl port-forward -n prometheus deploy/prometheus-server 8080:9090
Leave the terminal running. Then in your Cloud9 environment, click Tools / Preview / Preview Running Application. This will show a preview in a new IDE windows side by side with the terminal. You can click on the icon on the side of the Browser to pop up the preview to another window.
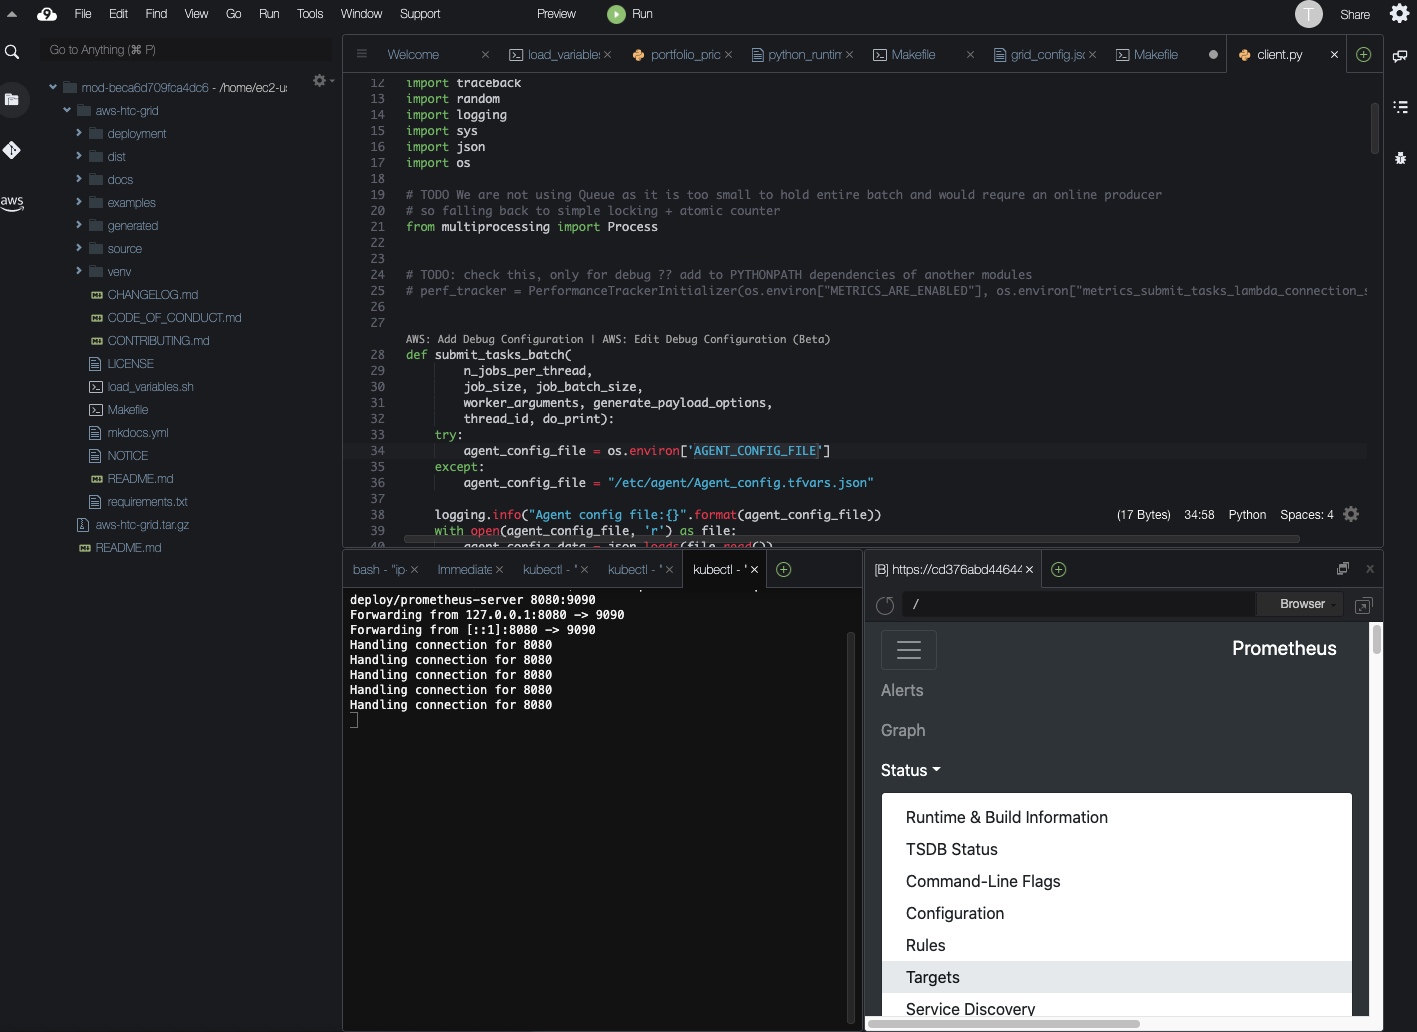
Prometheus has a set of targets that it takes metrics from using. You can check the targets by clicking on the Status / Apiserver